本篇博客主要介绍matplotlib模块。简单来说,Matplotlib 是 Python 的一个绘图库。它包含了大量的工具,你可以使用这些工具创建各种图形,包括简单的散点图,正弦曲线,甚至是三维图形。可以说matplotlib是python的数据可视化神器。 官网地址:https://matplotlib.org/index.html
安装
这里用pip安装,比较方便,如果不想用pip,还可以通过源码等方式安装,请参考官方文档。
pip install matplotlib
基本用法
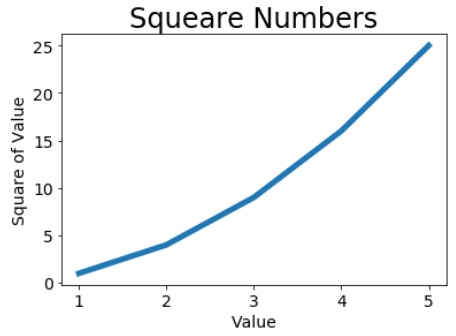
- 线条图形
import matplotlib.pylab as plt

# x轴数据
input_values = [1, 2, 3, 4, 5]
# y轴数据
squares = [1, 4, 9, 16, 25]
# linewidth参数指定线的宽度
plt.plot(input_values, squares, linewidth=5)
# 图形的标题
plt.title("Squeare Numbers", fontsize=24)
plt.xlabel("Value", fontsize=14)
plt.ylabel("Square of Value", fontsize=14)
# 刻度线的参数
plt.tick_params(axis='both', labelsize=14)
plt.show()
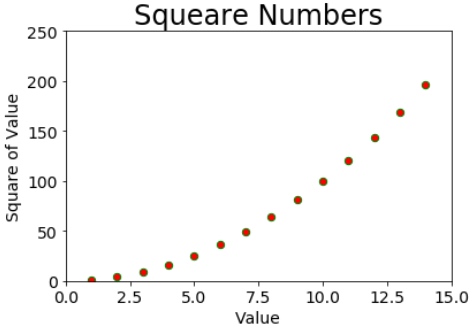
- 点状图形
import matplotlib.pyplot as plt

x_values = list(range(1, 15))
y_values = [x**2 for x in x_values]
# 修改点的颜色为红色,默认为蓝色。点的轮廓为绿色,默认为none。
plt.scatter(x_values, y_values, c='red', edgecolors='green', s=40)
plt.title("Squeare Numbers", fontsize=24)
plt.xlabel("Value", fontsize=14)
plt.ylabel("Square of Value", fontsize=14)
plt.tick_params(axis='both', which='major', labelsize=14)
# 坐标轴范围
plt.axis([0, 15, 0, 250])
plt.show()
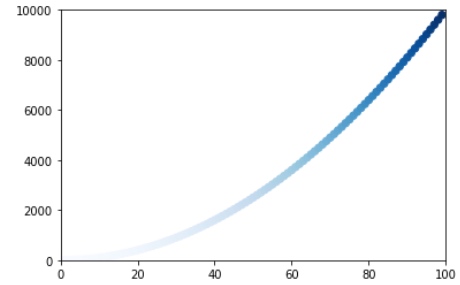
- 颜色映射
import matplotlib.pyplot as plt

x_values = list(range(1, 100))
y_values = [x**2 for x in x_values]
# 根据y轴的数据做颜色映射,蓝色越来越深
plt.scatter(x_values, y_values, c=y_values, cmap=plt.cm.Blues, s=40)
plt.axis([0, 100, 0, 10000])
# 保存图标,tight参数为裁剪空白区域
# 注意,保存之前不能show,如果show,则保存为空白。
plt.savefig('/root/Desktop/123.png', bbox_inches='tight')
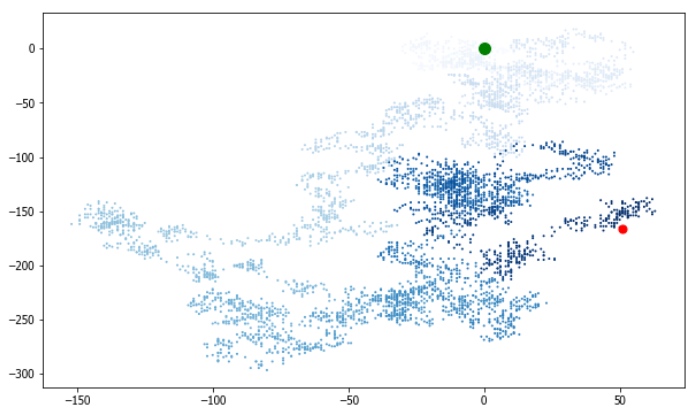
随机漫步
我们可以根据点状图,还有颜色渐变的方法,模拟一个分子运动的轨迹。
from random import choice

class RandomWalk():

    def __init__(self, num_points=5000):

        self.num_points = num_points
        self.x_values = [0]
        self.y_values = [0]

    def get_step(self):
        step = choice([1, -1]) * choice([0, 1, 2, 3, 4])
        return step

    def fill_walk(self):

        while len(self.x_values) < self.num_points:
            x_step = self.get_step()
            y_step = self.get_step()

            if x_step == 0 and y_step == 0:
                continue

            next_x = self.x_values[-1] + x_step
            next_y = self.y_values[-1] + y_step

            self.x_values.append(next_x)
            self.y_values.append(next_y)
这里写了一个随机运动的类,步数为5000步。
import matplotlib.pyplot as plt

while True:
    rw = RandomWalk()
    rw.fill_walk()
    plt.figure(figsize=(10, 6))
    point_number = list(range(rw.num_points))
    plt.scatter(rw.x_values, rw.y_values, c=point_number, cmap=plt.cm.Blues, s=1)
    # 突出起点和终点
    plt.scatter(0, 0, c='green', s=100)
    plt.scatter(rw.x_values[-1], rw.y_values[-1], c='red', s=50)
    # 隐藏坐标抽
    # plt.axes().get_xaxis().set_visible(False)
    # plt.axes().get_yaxis().set_visible(False)
    plt.show()
    # 输入n停止,输入其他任意键,生成一张新的随机漫步图
    keep_running = input("Make another walk?(y/n):")
    if keep_running == 'n':
        break